Ideas and Thoughts
Visibility Analysis of Among Us' Skeld
Question:

How do Visibility Metrics of the Game's Spatial Design influence the Risk of dying?
In addition, I also intend to understand if there is a distinction between the
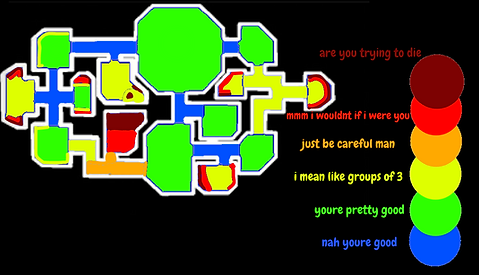
1) Perceived Risk (Where seems Dangerous?)
and the
2) Actual Risk (Where are players dying?)
Preliminary Analysis: How is Visibility used in the game?
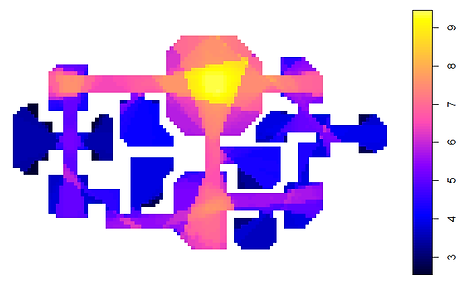
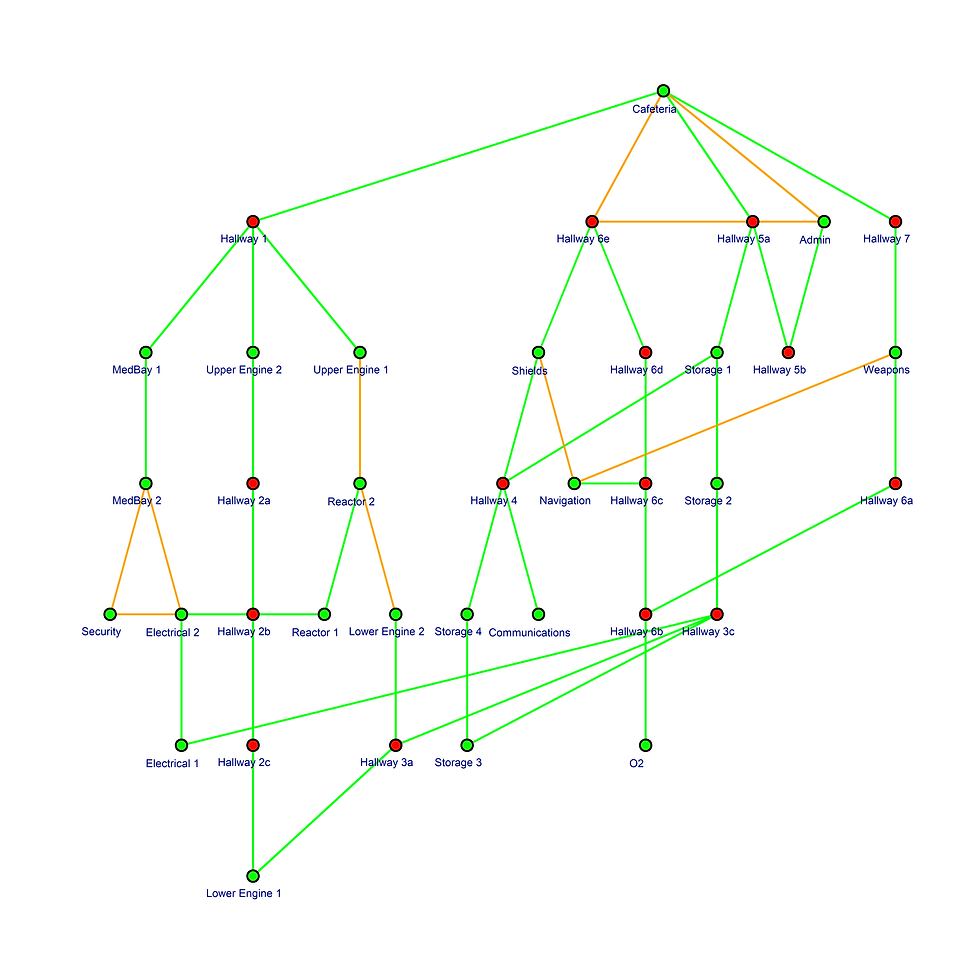
Visual Integration (Without Furniture)

Visual Integration (With Furniture)
This preliminary step studies how the strategic placement of non-interactive furniture affects visibility. This allows us to get a feel of how the concept of visibility was integrated into the game map's spatial design.
> Visual Integration is a normalized global measure, representing the depth of visibility of a single cell as compared to every other cell in the map - basically, how "visible you are" to everyone else.
By comparing both graphs, it is observed that with the presence of furniture objects, the visibility of the entire map seems to be a lot more balanced out. Apart from the Cafeteria (yellow spot) where players start from, the majority of the other spaces have values 5 and below.
This is rather interesting. I believe that the game designer intends for the entirety of his/her map space to be fully utilized. The furniture helps to "even" the visibility of these spaces, as a result, allow these spaces to have more "equality" in the form of social interactions/movements.
Preparing the Ref Mode: Using Data from Reddit
"Perceived Risk" (1): Source
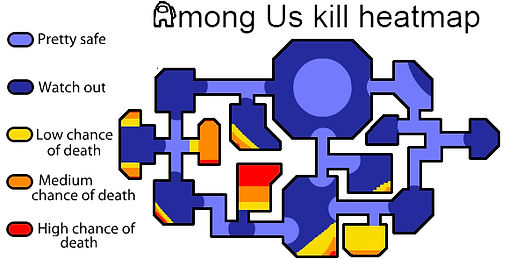
"Perceived Risk" (2): Source
Manual Conversion to Spatial Cells

Manual Conversion to Spatial Cells

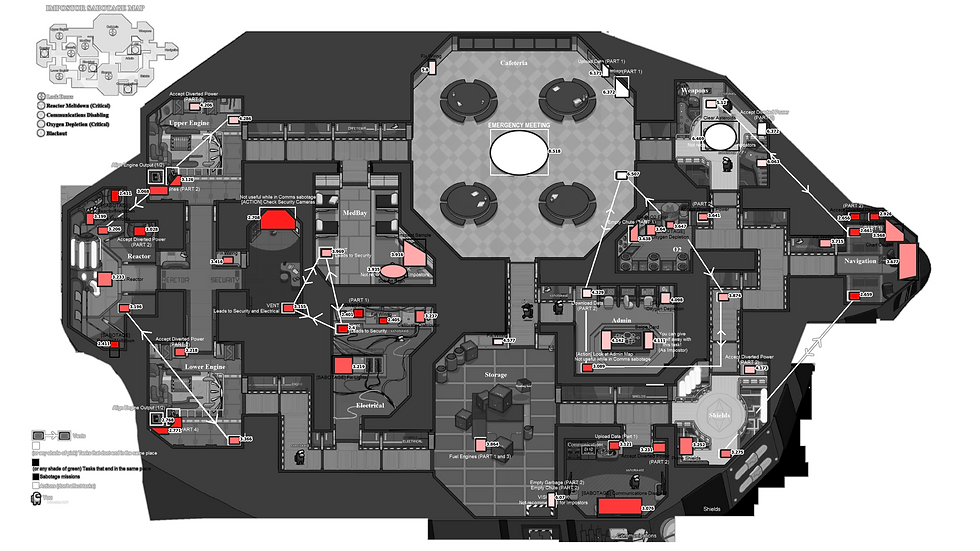
"Actual Risk" (3): Source

(Option 1) Validating Points on Spatial Cells

(Option 2) Kernal Density Estimation

Studying the Correlations: Visual Metrics against
"Perceived Risk" (1)
and
"Perceived Risk" (2)

Perceived Risk seems to correlate much more significantly to Visual Relativised Entropy as compared to the Visual Integration/Visual Mean Depth. Visual Entropy is essentially the complexity of travel which was based on Shannon's Entropy in Information Theory. Areas that are tucked in the corner and have a greater range of path choices, tend to have higher values.
> This hints to us that the Perception of this Risk could possibly be based on the accessibility of the space in addition to visibility.
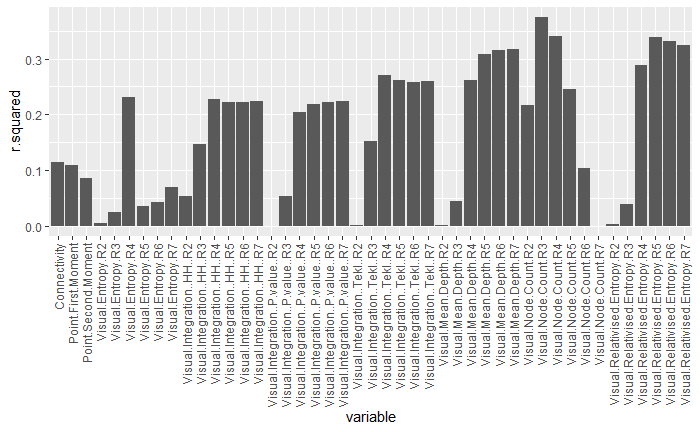
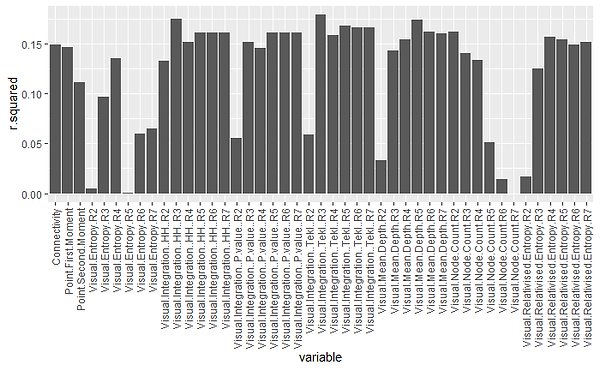
"Actual Risk" (3)
validating Points on Spatial Cells using R's Scale function
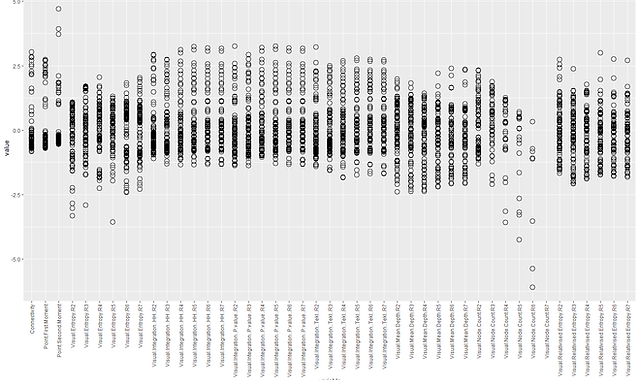
As seen on this scatter plot, it seems that there are distinctions in quantitative distribution between each visual metric. The deviation of Visual Entropy seems much higher than Visual Integration/ Visual Mean Depth.
>Visual integration seems like a good predictor of Actual Risk- it clusters well, and values tend to fall above the quantitative mean.
"Actual Risk" (3)
using KDE
Additionally, I have tried kernel distribution on these death instance points to spread out/smooth its probability to neighbouring cells in a controlled radius.
>After testing numerous radius for KDE, it seems to agree with the above observation that Visual Mean Depth/ Visual Integration appears to be slightly more representative of Actual Risk
TL;DR
It seems that Perceived Risk is more strongly correlated to Visual Entropy is the Complexity of Travel. It represents how this sense of risk is also guided by how we view Accessibility in the entirety of the space.
On the other hand, Actual Risk (in reality) is largely affected by mainly Visibility. This is interesting as it demonstrates a really simple concept - spaces, where people can see, tend to be a lot less dangerous than places where people can't.
Why did I think this study of Game Maps might be significant?
In the field of space syntax, I saw certain gaps in the existing research methodology/practice
which I was hoping to address:
1) There hasn't been many extensive studies on the range of theoretical visibility metrics
In practice, most VGA analyses utilize Visual Mean Depth/ Visual Integration. Only recently in 2019, there are more attempts to understand how all of them work. In this short project, I intend to use a wider range of metrics to also gain better insights in its utility
2) Analyzing different "types" of social behaviour
Research using Visibility Analysis (VGA) on spaces are often used to understand interactions/movement of pedestrian traffic. Social behaviour like perception and risk are uncommon and will be interesting to study
3) There hasn't been data which are fine-grained enough to understand
A great limitation in VGA would be the collection of data especially with regards to something as novel as "instances of death" or "perception of risk".
However, using game data will be useful as the spatial environment tends to be controlled, and the digitalization of movements allows it to be easily quantifiable.
Bonus Diagrams
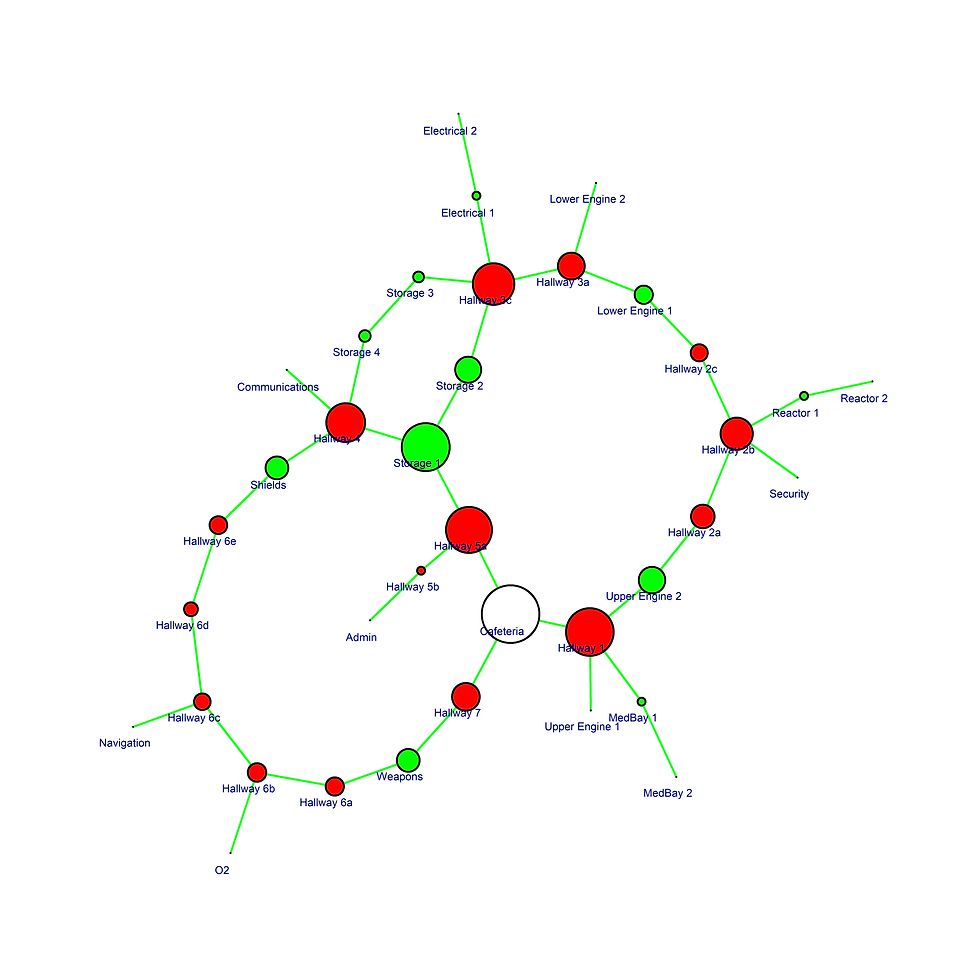
Visual Integration HH by Location of Individual Tasks

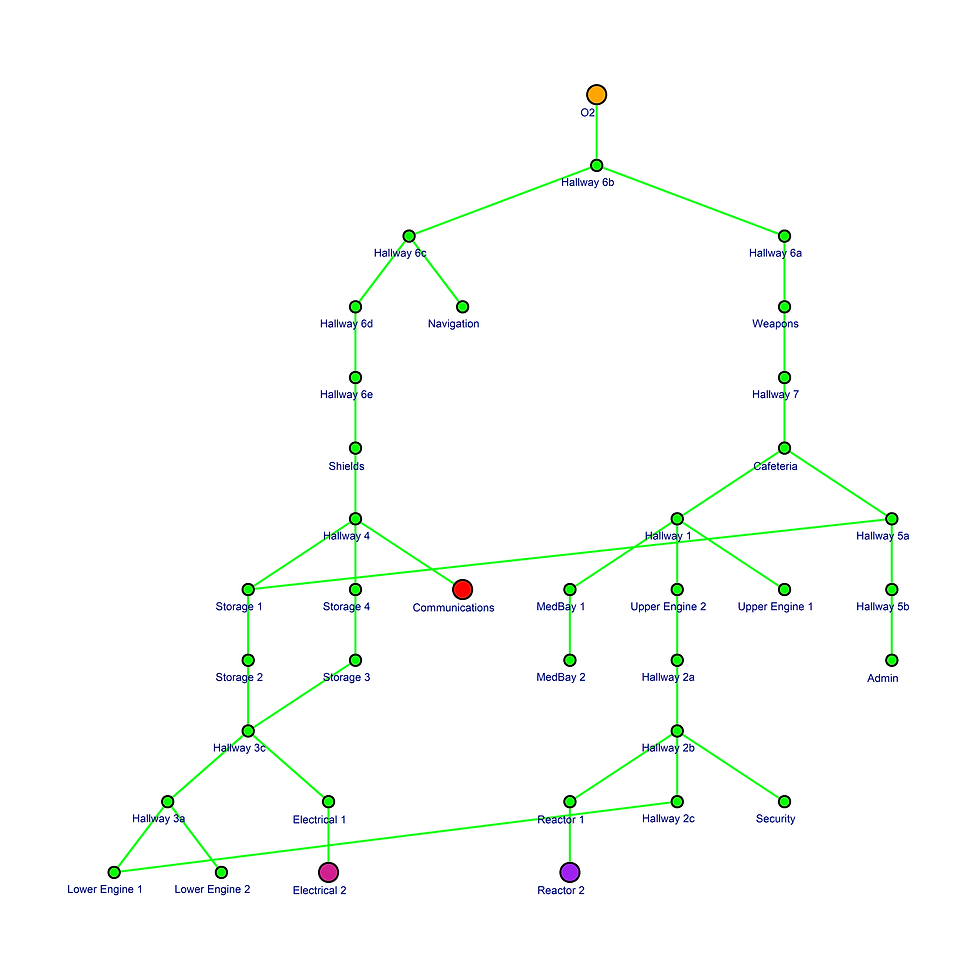
Topological Graph by Vents/Sabotages
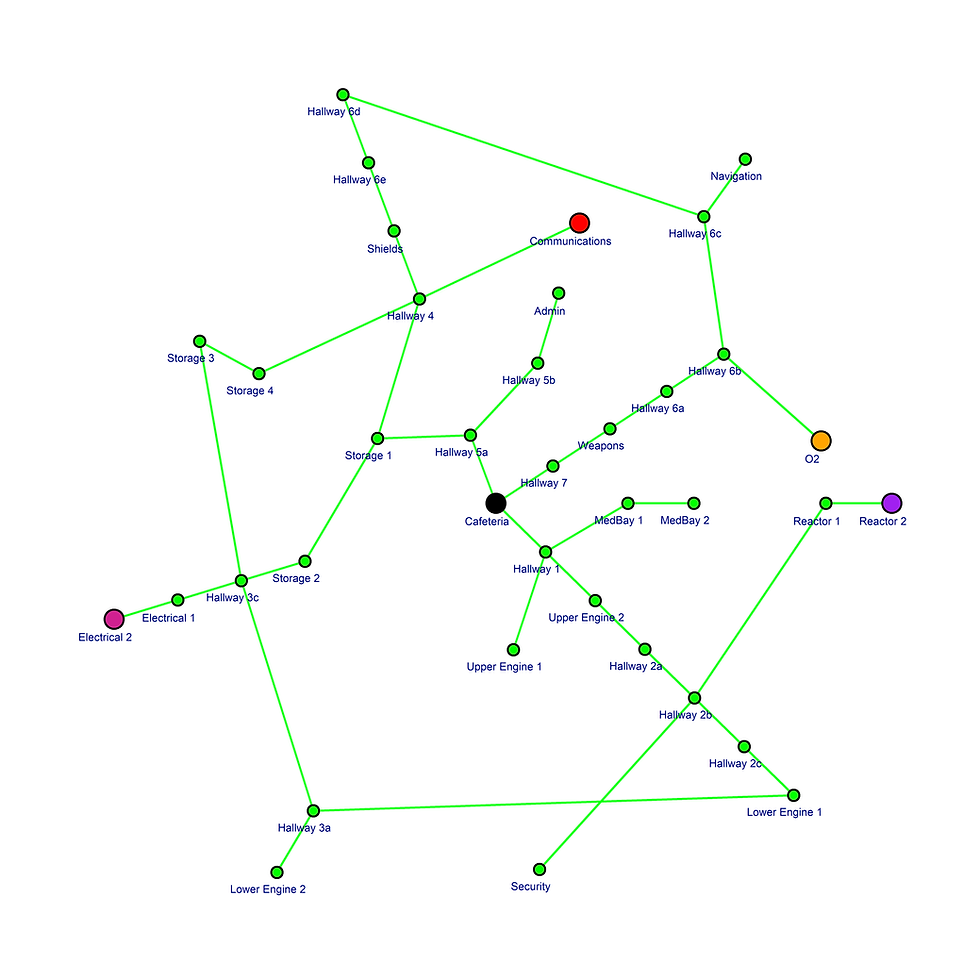
Alternative Visualization of Topological Graphs